Tutorials
These tutorials will teach you the fundamentals of creating and deploying a seasketch geoprocessing
project. They expect you already have a basic working knowledge of your computer, its operating system, command line interfaces, and web application development.
If you don't have this knowledge, then skill building and potentially mentorship may be needed for you to succeed. Here is a list of resources that can help you get started:
- Git and Github
- Node JS development
- VSCode integrated development environment (IDE)
- Code debugging
- Bash command line
- React user interface development
- Typescript code development
- QGIS and tutorials
- GDAL and tutorials
Assumptions
Unless otherwise instructed, assume:
- You are working within the VSCode editor, with your top-level directory open as the project workspace
- All commands are entered within a VSCode terminal, usually with the top-level project directory as the current working directory
Initial System Setup
This tutorial gets your system ready to create a new geoprocessing project or setup an existing project.
Examples of existing projects for reference and inspiration. Note, some may use older versions of the geoprocessing library and may look a little different.
You will need a computer running at least:
- Windows 11
- MacOS 11.6.8 Big Sur
- Linux: untested but recent versions of Linux such as Ubuntu, Debian, or Fedora should be possible that are capable of running VSCode and Docker Desktop.
Web browser:
- Chrome is the most common but Firefox, Safari, Edge can also work. Their developer tools will all be a little different.
Install Options
You have 3 options for how to develop geoprocessing projects
- Docker Desktop Environment
- Docker provides a sandboxed Ubuntu Linux environment on your local computer, setup specifically for geoprocessing projects.
- Best for: intermediate to power users doing development every day
- Pros
- Provides a fully configured environment, with installation of many of the third-party dependencies already take care of.
- Docker workspace is isolated from your host operating system. You can remove or recreate these environment as needed.
- You can work completely offline once you are setup.
- Cons
- You will need to get comfortable with Docker Desktop software.
- Docker is slower than running directly on your system (maybe 30%)
- Syncing data from network drives like Box into the Docker container is more challenging.
- MacOS Bare Metal / Windows WSL
- All geoprocessing dependencies are installed and maintained directly by you on your local computer operating system. For MacOS this means no virtualization is done. For Windows, this means running Ubuntu via WSL2 aka the Windows Subsystem for Linux.
- Best for - power user.
- Pros - fastest speeds because you are running without virtualization (aka bare metal)
- Cons - prone to instability and issues due to progression of dependency versions or operating system changes. Difficult to test and ensure stable support for all operating systems and processors (amd64, arm64).
Choose an option and follow the instructions below to get started. You can try out different options over time.
If Install Option #1 - Docker Desktop Environment
- Install Docker Desktop and make sure its running.
- If you have a Mac, choose either Apple processor or Intel processor as appropriate to your system. If you don't know which processor you have, click the apple icon in the top left and select
About This Mac
and look forProcessor
. - Install VS Code and open it.
- Clone the geoprocessing-devcontainer Github repository to your local system and open that folder in VSCode.
git clone https://github.com/seasketch/geoprocessing-devcontainer
Here are more detailed instructions to do this step:
-
From VSCode, click
Open Folder
button orFile -> Open Folder
and create or choose a folder where you keep source code. A folder calledsrc
orcode
in your users home directory is reasonable. Then clickSelect Folder
to finish. -
Press
Ctrl-J
orCmd-backtick
to open a terminal. The current directory of the terminal will be your workspace folder. -
Enter the command to clone the geoprocessing-devcontainer repository to your workspace.
git clone https://github.com/seasketch/geoprocessing-devcontainer
-
Click
Open Folder
button orFile -> Open Folder
and open the repo folder you just cloned. -
Press
Ctrl-J
orCmd-backtick
to open a terminal. -
Install required VSCode extensions. If you are already prompted to install suggested extensions, click to do so now, otherwise go to the
Extension
panel on the left side of the VSCode window and install the following extensions:- Remote Development
- Remote Explorer
- Docker
- Dev Containers
Once you have added the Dev Containers
extension you should be prompted to ”Reopen folder to develop in a container”. Do not do this yet.
- In the file
Explorer
panel, you will find a.devcontainer
folder. This top-level folder contains the configuration for thestable
geoprocessing devcontainer. - Make a copy of
.devcontainer/.env.template
file and name it.env
.- You don't need to add anything yet to your .env file, but it is required that it exists in the
.devcontainer
folder.
- You don't need to add anything yet to your .env file, but it is required that it exists in the
Now start the devcontainer:
Ctrl-Shift-P
orCmd-Shift-P
to open the VSCode command palette- type “Reopen in container” and select the Dev Container command to do so.
- Select the
Geoprocessing Local Pre-7.x
environment. - VSCode will pull the latest
geoprocessing-workspace
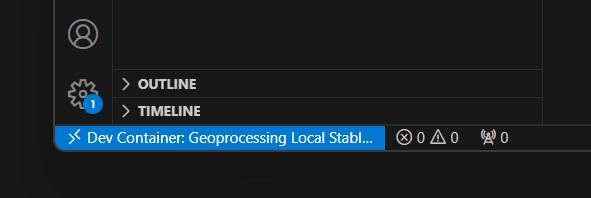
docker image, create a container with it, and start a remote code experience inside the container. - Notice the bottom left blue icon in your vscode window. It may say
Opening remote connection
and eventually will sayDev Container: Geoprocessing
. This is telling you that this VSCode window is running in a devcontainer environment.
You now have a devcontainer, ready to create a project in.
To exit your devcontainer:
- Click the blue icon in the bottom left, and then
Reopen locally
. This will bring VSCode back out of the devcontainer session. - You can also type
Ctrl-Shift-P
orCmd-Shift-P
and selectDev Containers: Reopen folder locally
.
To delete a devcontainer and start over:
- First, make sure you've pushed all of your code work to Github.
- Exit your active VSCODE devcontainer session.
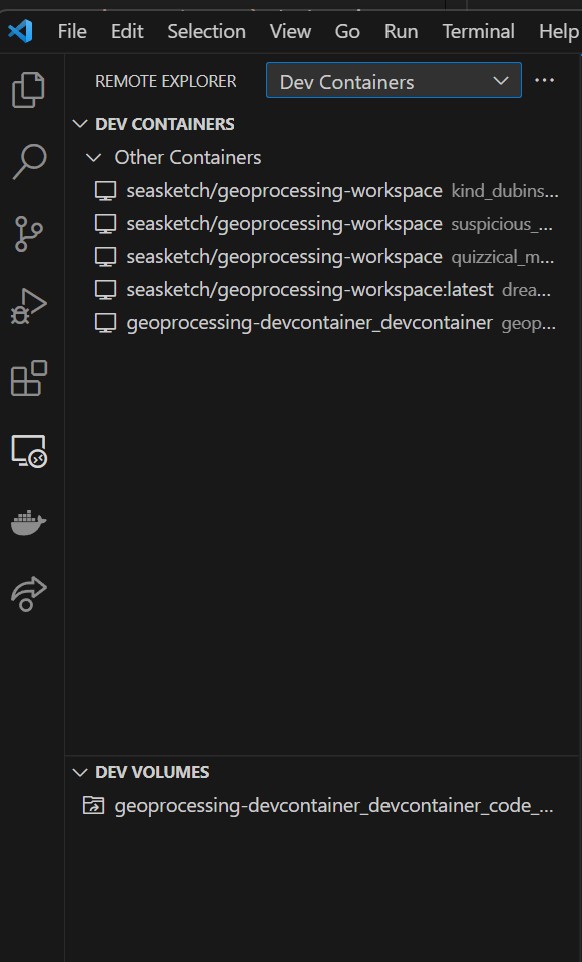
- Open the Remote Explorer panel in the left sidebar.
- Right-click and delete the appropriate devcontainers and volumes to start over. You can also see and delete them from the Docker Desktop app, but it is not obvious which containers and volumes are the ones you want.
- Press
Ctrl-J
orCtrl-backtick
to open a new terminal- The terminal will be in the
/workspaces
folder on the Ubuntu filesystem inside the container. It is completely separate from your host operating system. - Type the command
lsb_release -a
to see the Ubuntu version.
- The terminal will be in the
Install Option #2 - Bare Metal
Running 'bare metal' means running the geoprocessing framework directly on your computers operating system. It's up to you to install and maintain all necessary dependencies.
MacOS
-
Install Node JS >= v20.0.0
- nvm is great for this, then
nvm install v20
. May ask you to first install XCode developer tools as well which is available through the App Store or follow the instructions provided when you try to install nvm. - Then open your Terminal app of choice and run
node -v
to check your node version
- nvm is great for this, then
-
Install VS Code
- Install recommended extensions when prompted. If not prompted, go to the
Extensions
panel on the left side and install the extensions named in this file
- Install recommended extensions when prompted. If not prompted, go to the
-
Install NPM package manager >= v10.5.0 after installing node. The version that comes with node may not be recent enough.
npm --version
to checknpm install -g latest
-
Install GDAL
- First install homebrew
brew install gdal
-
Install Java runtime for MacOS (required for testing with Amazon DynamoDb Local)
-
Create a free Github account if you don't have one already
Windows
For Windows, you won't actually be running bare metal. your geoprocessing
project and the underlying code run in a Docker container running Ubuntu Linux. This is done using the Windows Subsystem for Linux (WSL2) so performance is actually quite good. Docker Desktop and VSCode both know how to work seamlessly with WSL2. Some of the building blocks you will install in Windows (Git, AWSCLI) and link them into the Ubuntu Docker container. The rest will be installed directly in the Ubuntu Docker container.
In Windows:
- Install WSL2 with Ubuntu distribution
- Install Docker Desktop with WSL2 support and make sure Docker is running
- Open start menu ->
Ubuntu on Windows
- This will start a bash shell in your Ubuntu Linux home directory
In WSL Ubuntu:
- Install Java runtime in Ubuntu (required by AWS CDK library)
- Install Git in Ubuntu and Windows
- Install VS Code in Windows and setup with WSL2.
- Install recommended extensions when prompted. If not prompted, go to the
Extensions
panel on the left side and install the extensions named in this file
- Install recommended extensions when prompted. If not prompted, go to the
- Install Node JS >= v16.0.0 in Ubuntu
- nvm is great for this, then
nvm install v16
. - Then open your Terminal app of choice and run
node -v
to check version
- nvm is great for this, then
- Install NPM package manager >= v8.5.0 after installing node. The version that comes with node may not be recent enough.
npm --version
to checknpm install -g latest
Final Steps
The last step, regardless of install option, is to set the username and email address git will associate with your commits.
You can set these per repository, or globally for all repositories on your system (and override as needed). Here's the commands to set globally for your environment.
git config --global user.name "Your Name"
git config --global user.email "yourusername@youremail.com"
Now verify it was set:
# If you set global - all repos
cat ~/.gitconfig
# If you set local - current repo
cat .git/config
Your devcontainer environment is now ready for a project
Create a New Geoprocessing Project
Assuming initial system setup is complete.
This tutorial now walks through generating a new geoprocessing project codebase and committing it to Github.
Create Github Repository
First, we'll establish a remote place to store your code.
- Create a new Github repository called
fsm-reports-test
(you can pick your own name but the tutorial will assume this name). When creating, do not initialize this repository with any files like a README. - In your VSCode terminal, make sure you are in your projects top-level directory. A shorthand way to do this is
cd ~/src/fsm-reports-test
.
Connect Git Repo
Now enter the following commands to establish your project as a git repository, connect it to your Github repository you created as a remote called "origin", and finally push your code up to origin.
git init
git add .
git commit -m "first commit"
git branch -M main
git remote add origin https://github.com/PUT_YOUR_GITHUB_ORG_OR_USERNAME_HERE/fsm-reports-test.git
git push -u origin main
It may ask you if it can use the Github extension to sign you in using Github. It will open a browser tab and communicate with the Github website. If you are already logged in there, then it should be done quickly, otherwise it may have you log-in to Github.
You should eventually see your code commit proceed in the VSCode terminal. You can then browse to your Github repository and see that your first commit is present at https://github.com/[YOUR_GITHUB_ORG_OR_USERNAME]/foo-reports
After this point, you can continue using git commands right in the terminal to stage code changes and commit them, or you can use VSCode's built-in git support.
Get VSCode Ready
If running devcontainer (Install Option 1)
- Ensure your VSCode workspace is connected to your devcontainer
- You can now create as many geoprocessing projects as you want under
/workspaces
and they will persist as long as the associated docker volume is maintained. Each project you create should be backed by a Github repository which you should regularly commit your code to in order to ensure it's not lost.
To get started:
- Open a terminal with Ctrl-J if not already open
cd /workspaces
If Running Bare Metal (Install Option 2)
Windows:
- Open start menu ->
Ubuntu on Windows
- This will start a bash shell in your Ubuntu Linux home directory
- Create a directory to put your source code
mkdir -d src
- Start VSCode in the Ubuntu terminal
code .
- This will install a vscode-server package that bridges your Windows and Ubuntu Linux environments so that VSCode will run in Windows and connect with your source code living in your Ubuntu Linux project directory.
- Open a terminal in VSCode with
Ctrl-J
in Windows or by clicking Terminal -> New Terminal.- The current directory of the terminal should be your project folder.
MacOS:
- Open Finder -> Applications -> VSCode
- Open a terminal in VSCode with
Command-J
or by clicking Terminal -> New Terminal - Create a directory to put your source code and change to that directory
mkdir -d src && cd src
Initialize Geoprocessing Project
Now we'll create a new project using geoprocessing init
.
npx @seasketch/geoprocessing@latest init
This command uses npx
, which comes with npm
and allows you to execute commands in a package. In this case it will fetch the geoprocessing
library from the npm
repository and run the geoprocessing init
command to create a new project.
init
will download the framework, and then collect project metadata from you by asking questions.
Project metadata
As an example, assume you are developing reports for the country of The Federated States of Micronesia
.
? Choose a name for your project fsm-reports-test
? Please provide a short description of this project Test drive
Now paste the URL of the github repository you created in the first step
? Source code repository location https://github.com/[YOUR_USERNAME_OR_ORG]/fsm-reports-test
You will then be asked for the name and email that establishes you as the author of this project. It will default to your git settings. Change it as you see fit for establishing you as the author of the project.
? Your name [YOUR_NAME]
? Your email [YOUR_EMAIL]
Now provide your organization name associated with authoring this project
? Organization name (optional)
Choose a software license. SeaSketch and Geoprocessing both use BSD-3 (the default choice). If you are not a member of SeaSketch you are not required to choose this. In fact, you can choose UNLICENSED
meaning proprietary or "All rights reserved" by you, the creator of the work.
? What software license would you like to use? BSD-3-Clause
Choose an AWS region you would like to deploy the project. The most common is to choose us-west-1
or us-east-2
, the US coast closest to the project location. In some circumstances it can make sense to choose locations in Europe, Asia, Australia, etc. that are even closer but in practice this usually doesn't make a significant difference.
? What AWS region would you like to deploy functions in?
Now enter the type of planning area for your project. Choose Exclusive Economic Zone which is the area from the coastline to 200 nautical miles that a country has jurisdiction over.
? What type of planning area does your project have? Exclusive Economic Zone (EEZ)
Since you selected EEZ, it will now ask what countries EEZ to use. Choose Micronesian Exclusive Economic Zone
? What EEZ is this for? Micronesian Exclusive Economic Zone
If you answered Other
to type of planning area it will now ask you for the name of this planning area.
? Is there a different name to use for this planning area than Micronesian Exclusive Economic Zone? (Use arrow keys)
❯ Yes
No
Answer No
. If you answered yes it would ask you:
What is the common name for this planning area?
Finally, you will be asked to choose a starter template. Choose template-ocean-eez
. It will come with some features out of the box that are designed for EEZ planning. template-blank-project
is a barebones template and let's you start almost from scratch.
? What starter-template would you like to install?
template-blank-project - blank starter project
❯ template-ocean-eez - template for ocean EEZ planning project
After pressing Enter, your project will finish being created and installing all dependencies in ~/src/fsm-reports
.
Blank starter project
Note, if you had selected Blank starter project
as your template, it would then ask you for the bounding box extent of your projects planning area, in latitude and longitude.
? What is the projects minimum longitude (left) in degrees (-180.0 to 180.0)?
? What is the projects minimum latitude (bottom) in degrees (-180.0 to 180.0)?
? What is the projects maximum longitude (right) in degrees (-180.0 to 180.0)?
? What is the projects maximum latitude (top) in degrees (-180.0 to 180.0)?
The answers to these questions default to the extent of the entire world, which is a reasonable place to start. This can be changed at a later time.
Open in VSCode Workspace and Explore Structure
Next, to take full advantage of VSCode you will need to open your new project and establish it as a workspace.
If Running Devcontainer (Install Option 1)
Once you have more than one folder under /workspaces
backed by a git repository, VSCode will default to a multi-root
workspace.
For the best experience, you will want open a single workspace in your VSCode for a single folder in your devcontainer.
File
-> Open folder
-> /workspaces/fsm-reports-test
VSCode should now reopen the under this new workspace, using the existing devcontainer, and you're ready to go.
If Running Bare Metal (Install Option 2)
Type Command-O
on MacOS or Ctrl-O
on Windows or just click File
->Open
and select your project under [your_username]/src/fsm-reports-test
VSCode will re-open and you should see all your project files in the left hand file navigator.
- Type
Command-J
(MacOS) orCtrl-J
(Windows) to reopen your terminal. Make this a habit to have open.
Project Structure
Next, take some time to learn more about the structure of your new project, and look through the various files. You can revisit this section as you get deeper into things.
Configuration Files and Scripts
There are a variety of project configuration files. Many have been pre-populated usings your answers to the initial questions. You can hand edit most of these files later to change them, with some noted exceptions.
package.json
- Javascript package configuration that defines things like the project name, author, and third-party dependencies. The npm command is typically used to add, upgrade, or remove dependencies usingnpm install
, otherwise it can be hand-edited.tsconfig.json
- contains configuration for the Typescript compilerproject/
- contains project configuration files.basic.json
- contains basic project configuration.planningAreaType
:eez
orother
- bbox - the bounding box of the project as [bottom, top, left, right]. This generally represents the area that users will draw shapes. It can be used as a boundary for clipping, to generate examples sketches, and as a window for fetching from global datasources.
planningAreaId
- the unique identifier of the planning region used by the boundary dataset. If your planningAreaType iseez
and you want to change it, you'll find the full list in github, just look at the UNION property for the id to useplanningAreaName
- the name of the planning region (e.g. Micronesia)externalLinks
- central store of links that you want to populate in your reports.
geoprocessing.json
- file used to register assets to be bundled for deployment. If they aren't registered here, then they won't be included in the bundle.geographies.json
- contains one or more planning geographies for your project. If you chose to start with a blank project template, you will have a default geography of the entire world. If you chose to start with the Ocean EEZ template, you will have a default geography that is the EEZ you chose at creation time. Geographies must be manually added/edited in this file. You will then want to re-runprecalc
andtest
to process the changes and make sure they are working as expected. Learn more about geographiesdatasources.json
- contains an array of one or more registered datasources, which can be global (url) or local (file path), with a format of vector or raster or subdivided. Global datasources can be manually added/edited in this file, but local datasources should use the import process. After import, datasources can be manually added/edited in this file. You will then want to runreimport:data
,precalc:data
,precalc:clean
, andtest
to process the changes and make sure they are working as expected. Learn more about datasourcesmetrics.json
- contains an array of one or more metric groups. Each group defines a metric to calculate, with one or more data classes, derived from one or more datasources, measuring progress towards a planning objective. An initial boundaryAreaOverlap metric group is included in the file by default that uses the global eez datasource. Learn more about metricsobjectives.json
- contains an array of one or more objectives for your planning process. A default objective is included for protection of20%
of the EEZ. Objectives must be manually added/edited in this file. Learn more about objectivesprecalc.json
- contains precalculated metrics for combinations of geographies and datasources. Specifically it calculates for example the total area/count/sum of the portion of a datasources features that overlap with each geography. This file should not be manually edited. If you have custom precalculations to do for your project, then use a separate file. Learn more about the precalc command.
The object structure in many of the JSON files, particularly the project
folder, follow strict naming and structure (schema) that must be maintained or you will get validation errors when running commands. Adding additional undocumented properties may be possible, but is not tested. The schemas are defined here:
Project Assets
src/
- contains all source codeclients/
- report clients are React UI components that can be registered with SeaSketch and when given a sketch URL as input, are able to run the appropriate geoprocessing functions and display a complete report. This can include multiple report pages with tabbed navigation.components/
- components are the UI building blocks of report clients. They are small and often reusable UI elements. They can be top-level ReportPage components, ResultCard components within a page that invoke geoprocessing functions and display the results, or much lower level components like custom Table or Chart components. You choose how to build them up into sweet report goodness.functions/
- contains preprocessor and geoprocessor functions that take input (typicall sketch features) and return output (typically metrics). They get bundled into AWS Lambda functions and run on-demand.i18n/
- contains building blocks for localization aka language translation in reports.scripts/
- contains scripts for working with translationslang/
- contains english terms auto-extracted from this projects report clients and their translations in one or more languages.baseLang/
- contains english terms and their translations for all UI components and report client templates available through the geoprocessing library. Used to seed thelang
folder and as a fallback.config.json
- configuration for integration with POEditor localization service.extraTerms.json
- contains extra translations. Some are auto-generated from configuration on project init, and you can add more such as plural form of terms.i18nAsync.ts
- creates an i18next instance that lazy loads language translations on demand.i18nSync.ts
- creates an i18nnext instance that synchronously imports all language translations ahead of time. This is not quite functional, more for research.supported.ts
- defines all of the supported languages.
A ProjectClient class is available in project/projectClients.ts
that is used in project code for quick access to all project configuration including methods that ease working with them. This is the bridge that connects configuration with code and is the backbone of every geoprocessing function and report client.
Other Files
node_modules
- contains all of the npm installed third-party code dependencies defined in package.jsonREADME.md
- default readme file that becomes the published front page of your repo on github.com. Edit this with information to help your users understand your project. It could include information or sources on metric calculations and more.package-lock.json
- contains cached metadata on the 3rd party modules you have installed. Updates to this file are made automatically and you should commit the changes to your repository at the same time as changes to your package.json..nvmrc
- a lesser used config file that works with nvm to define the node version to use for this project. If you use nvm to manage your node version as suggested then you can runnvm use
in your project and it will install and switch to this version of node.
To learn more, check out the Architecture page
Generate Examples
In order to create and test out the functions and report clients installed with template-ocean-eez
, we need sample data that is relevant to our planning area. Scripts are available that make this easy.
genRandomSketch
- generates a random Sketch polygon within the extent of your planning area, which are most commonly used as input to geoprocessing functions. Run it without any arguments to generate a single Sketch polygon in the examples/sketches
directory of your project. Run it with an argument of 10
and it will generate a SketchCollection with 10 random Sketch polygons.
npx tsx scripts/genRandomSketch.ts
npx tsx scripts/genRandomSketch.ts 10
genRandomFeature
- generates random Feature Polygons within the extent of your planning area, which are most commonly used as input to preprocessing functions. Run it without any arguments to generate a single Feature polygon in the examples/features
directory of your project.
npx tsx scripts/genRandomFeature.ts
Differences
Look closely at the difference between the example features and the example sketches and sketch collections. Sketch and sketch collections are just GeoJSON Feature and FeatureCollection's with some extra attributes. That said, sketches and sketch collections are technically not compliant with the GeoJSON spec but they are often passable as such in most tools.
Create Custom Sketches
In addition to these scripts, you can create features and sketches using your GIS tool of choice, or draw your own polygons using geojson.io. If you already have your SeaSketch project site set-up, you can draw a sketch and export it as geojson, uploading it to the examples/sketches
directory.
Import Data
Navigate to datasources.json
. This is where available data sources to use in reports are listed. When we import a new datasource, an entry will be automatically added to this file.
Link Project Data
In order to import
and publish
local project data to the cloud, it will need to be accessible on your local computer. There are multiple ways to do this, choose the appropriate one for you.
Option 1. Keep your data where it is
Nothing to do, you will keep your data where it is on your local computer, and provide a direct path to this location on import.
Pros:
- Simple. Can start with this and progress to more elaborate strategies
- Keeps your data separate from your code
- Can import data from different parts of your filesystem
Cons:
- Can make it hard to collaborate with others because they'll have to match your file structure, which may not be possible for some reason.
Option 2. Keep your data in your project repository
Copy your datasources directly into the data/src
directory.
Pros:
- Data and relative import paths are consistent between collaborators
- Data can be kept under version control along with your code. Just check out and it's ready to go.
Cons:
- You have an additional copy of your data to maintain. You may not have a way to tell if your data is out of data or not from the source of truth.
- The github repository can get big fast if you have or produce large datasets.
- If your data should not be shared publicly, then the code repo will need to be kept private, which works against the idea of transparent and open science.
- If any file is larger than 100MB it will require use of Git LFS
- Maximum of 5gb file size
MacOS this could be as easy as:
cp -r /my/project/data data/src
Windows, you can copy files from your Windows C drive into Ubuntu Linux using the following:
cp -r /mnt/c/my_project_data data/src
Change the .gitignore
file to allow you to commit your data/src and data/dist directory to Git. Remove the following lines:
data/src/**
data/dist/**
It's up to you to not make sensitive data public. By choosing this option, you are possibly committing to it always being private and under managed access control.
Option 3. Link Data
A symbolic link, is a file that points to another directory on your system. What you can do is create a symbolic link at data/src
that points to the top-level directory where you data is maintained elsewhere on your system.
Pros:
- Keeps your data separate from your code but accessed in a consistent way through the
data/src
path. - Works with cloud-based drive share products like Box and Google Drive which can be your centralized source of truth.
Cons:
- Symbolic links can be a little harder to understand and manage, but are well documented.
- People managing the source of truth that is linked to may update or remove the data, or change the file structure and not tell you. Running
reimport
scripts will fail anddatasources.json
paths will need to be updated to the correct place.
Steps:
- First, if you use a Cloud Drive product to share and sync data files, make sure your data is synced and you know the path to access it. See access Cloud Drive folder
- Assuming you are using MacOS and your username is
alex
, your path would be/Users/alex/Library/CloudStorage/Box-Box
To create the symbolic link, open a terminal and make sure you are in the top-level directory of your geoprocessing project:
ln -s /Users/alex/Library/CloudStorage/Box-Box data/src
Confirm that the symbolic link is in place, points back to your data, and you can see your data files
ls -al data
ls -al data/src
If you put your link in the wrong folder or pointed it to the wrong place, you can always just rm data/src
to remove it, then start over. It will only remove the symbolic link and not the data it points to.
In Summary
None of these options solve the need for collaborators to manage data carefully, to communicate changes, and to ensure that updates are carried all the way through the data pipeline in a coordinated fashion. The data won't keep itself in sync.
For all of these options, you can tell if your data is out of sync:
data/src
is out of date if theDate modified
timestamp for a file is older than the timestamp for the same file wherever you source and copy your data from.data/dist
is out of date withdata/src
if theDate modified
timestamp for a file is older than the timestamp for the same file indata/src
.
Importing Your Data
This tutorial will use example data for the Federated States of Micronesia that has already been prepared.
cd data/src
wget https://github.com/user-attachments/files/17577047/FSM_MSP_Data_Example_v2.zip
unzip FSM_MSP_Data_Example_v2.zip
mv FSM_MSP_Data_Example_v2/* .
rm -rf FSM_MSP_Data_Example_v2*
Import vector datasource
Vector datasets can be any format supported by GDAL "out of the box". Common formats include:
- GeoJSON
- GeoPackage
- Shapefile
- File Geodatabase
Start the import process and it will ask you a series of questions, press Enter after each one, and look to see if a default answer is provided that is sufficient:
npm run import:data
? Type of data? Vector
? Will you be precalculating summary metrics for this datasource after import? (Typically yes if reporting sketch % overlap with datasource) Yes
Respond Yes
to allow precalculation.
By default mulitpolygons are split into polygons, which can save bandwidth when fetching features that overlap with a sketch.
? Should multi-part geometries be split into multiple single-part geometries? (can increase sketch overlap calc performance by reducing number of polygons
to fetch) Yes
Respond yes to splitting polygons.
? Enter path to src file (with filename) data/src/current-vector.gpkg
We'll import data from the current-vector
geopackage.
It will now ask you for a datasource name, it should be unique, different than any other datasourceId in projects/datasources.json
. The command won't let you press enter if it's a duplicate.
? Choose unique datasource name (use letters,numbers, -, _ to ensure will work) eez
Enter the datasource name eez
.
A layer name must also be specified if your datasource can store multiple layers within it (geopackage). You can use the ogrinfo
command to quickly see what layers are present in a vector dataset. If your dataset can only store one datasource such as a shapefile or a GeoJSON file, then the layer name should just be the name of the file (minus the extension). You can use the QGIS project file in the example data to view the available layers in the geopackage.
? Enter layer name, defaults to filename (eez_mr_osm)
The layer in this geopackage we want is called eez_mr_osm
so enter that now.
If your dataset contains one or more properties that classify the vector features into one or more categories, and you want to report on those categories in your reports, then you can enter those properties now as a comma-separated list. For example a coral reef dataset containing a type
propertie that identifies the type of coral present in each polygon. In the case of our EEZ dataset, there are no properties like this so this question is left blank.
? Enter feature property names that you want to group metrics by (
separated by a comma e.g. prop1,prop2,prop3)
The eez dataset has no attributes that we want to group features by so press Enter to skip this question.
By default, all extraneous properties will be removed from your vector dataset on import in order to make it as small as possible. Any additional properties that you want to keep in should be specified in this next question. If there are none, just leave it blank.
? Enter additional feature property names to keep in final datasource (separated by a comma e.g. prop1,prop2,prop3). All others will be filtered out
The eez dataset has no additional properties we want to keep so press Enter to skip this question.
By default, data will be imported into flatgeobuf format. Often, that's all you need. But if you want to be able to precalculate stats for this dataset, or import JSON data directly into your geoprocessing functions, or just have a human readable version of the data to verify it, then you want to include the GeoJSON format.
? The following formats will automatically be created: fgb. What additional formats would you like created? (Press <space> to select, <a> to toggle all, <i> to invert selection, and <enter>
to proceed) (Press <space> to select, <a> to toggle all, <i> to invert selection)
◯ json - GeoJSON
For the eez
dataset, we want to precalculate state, so press spacebar to select json
and then press the Enter
key to proceed.
At this point the import will proceed and various log output will be generated. Once complete you will find:
- The output file
data/dist/eez.fgb
. - An updated
project/datasources.json
file with a new entry at the bottom with a datasourceId ofeez
. You'll see all the answers to your questions.
If the import fails, try again double checking everything. It is most likely one of the following:
- You specified the wrong source file path.
- You specified the wrong layer name
You can now make edits to datasource.json at any time and then run reimport:data
to regenerate the files in data/dist
.
Import raster datasource
Raster datasets can be any format supported by GDAL "out of the box". Common formats include:
- GeoTIFF
Importing a raster dataset into your project will:
- Reproject the data to an equal area projection called WGS 84 / NSIDC EASE-Grid 2.0 Global, aka EPSG:6933. This makes accurate area calculations possible.
- Extract a single band of data (the underlying geoblaze library is not performant with multi-band data)
- Transform the raster into a cloud-optimized GeoTIFF
- Calculates overall statistics including total count and if categorical raster, a count per category
- Output the result to the
data/dist
directory, ready for testing - Add datasource to
project/datasource.json
Start the import process and it will ask you a series of questions, press Enter after each one, and look to see if a default answer is provided that is sufficient:
npm run import:data
? Type of data? Raster
? Will you be precalculating summary metrics for this datasource after import? (Typically yes if reporting sketch % overlap with datasource) Yes
You will then be mistakenly asked about splitting multi-part geometries. This is an error. Just hit enter to continue
Should multi-part geometries be split into multiple single-part geometries? (can increase sketch overlap calc performance by reducing number of polygons to fetch)
We'll import the yesson_octocorals
TIFF file
? Enter path to src file (with filename) data/src/yesson_octocorals.tif
Now enter the datasource name octocorals
? Choose unique datasource name (a-z, A-Z, 0-9, -, _), defaults to filename octocorals
If the raster has more than one band of data, select the band you want to import, the first band is 1.
```bash
? Enter band number to import 1
This raster has just 1 band so accept the default of 1
Choose what the raster data represents.
Quantitative
- measures one thing. This could be a binary 0 or 1 value that identifies the presence or absence of something, or a value that varies over the geographic surface such as temperature.
Categorical
- measures presence/absence of multiple groups. The value of each cell in the band is a numeric group identifier, and thus each cell can represent one and only one group at a time.
❯ Quantitative - cell value (number) represents a measurement of a single thing
Categorical - cell value (number) represents a category the cell is assigned to
The octocorals raster is a binary 0/1 raster representing absence or presence, so choose Quantitative
.
It will then ask what raster formats you would like to import. There is only one answer so just hit Enter.
? What formats would you like to publish? Suggested formats already selected tif - Cloud Optimized GeoTiff
It will then ask you if there is a nodata value for this raster. QGIS or the gdalinfo
command can tell you this.
? Enter nodata value for raster or leave blank
For octocorals, there is no nodata value so just hit Enter.
At this point the import will proceed and various log output will be generated.
Once complete you will find:
- The output file
data/dist/octocorals.tif
- An updated
project/datasources.json
file with a new entry at the bottom with a datasourceId ofoctocorals
.
If the import fails, try again double checking everything. It is most likely one of the following:
- You specified the wrong source file path.
- You specified the wrong band number
Update Geography
Open the file project/geographies.json
. You will find a default geography object there with geographyId: "eez-mr-v12
. Replace this entire geography object with the following new one:
{
"geographyId": "eez",
"datasourceId": "eez",
"display": "Micronesian Exclusive Economic Zone",
"groups": ["default-boundary"],
"precalc": true
}
This effectively updates the eez
geography to use the local datasource you just imported, instead of the global datasources that comes with the project. This is common if you have a local datasource that is more accurate than the global datasource.
Update Metric Group
Now open the file project/metrics.json
. You will find a preinstalled MetricGroup object there with metricId
of boundaryAreaOverlap
.
Change it's datasourceId
value from global-eez-mr-v12
to eez
.
This will configure the boundaryAreaOverlap
geoprocessing function to use the eez
datasource when calculating its boundary overlap values. The SizeCard
report component will also uses this MetricGroup configuration when reading and reporting this metric. You'll learn more about this later.
Precalc Data
Precalc is all about calculating big expensive summary spatial metrics ahead of time. The question our report needs to answer is "how much of all octocorals in the EEZ, is within my Sketch polygon"?
This is calculated as:
octocorals sketch % = area of octocorals within sketch / area of octocorals within EEZ
We can precalculate the denominator of this equation ahead of time. The precalc
command will calculate how much of a datasources features/raster cells is within each project geography. This can measured as area
, sum
of value
, count
of features/raster cells, etc.
The first way to enable geographies and datasources for precalc is to ensure that they have precalc: true
in geographies.json and datasources.json. This is already true for the eez
and octocorals
.
Now let's run the precalc:
npm run precalc:data
Now select Yes, by datasource
and then Let me choose
.
Press space to select only:
eez
octocorals
Then press enter and:
- Precalc will start a web server on localhost port 8001 that serve up data from
data/dist
. - Precalc will see the two datasources you selected and that they have
precalc: true
. It will also see the one geographyeez
that is defined in geographies.json that hasprecalc: true
. It will then calculatearea
,sum
, andcount
metrics for each datasource, in combination with each geography. project/precalc.json
will be updated with the new values.
Tips for precalculation:
- Do not be concerned if you see an error that an ".ovr" file could not be found. This is expected.
- You have to re-run
precalc:data
every time you change a geography or datasource. - Set
precalc:false
for datasources that are not currently used, or are only used to define a geography (not displayed in reports). This is why the datasource for the default geography for a project is always set by default toprecalc: false
. - If you are using one of the global-datasources in your project, and you want to use it in reporting % sketch overlap, so you've set
precalc:true
, strongly consider defining abboxFilter
. This will ensure that precalc doesn't have to fetch the entire datasource when precalculating a metric, which can be over 1 Gigabyte in size. Also consider setting apropertyFilter
to narrow down to just the features you need. This filter is applied on the client-side so it won't reduce the number of features you are sending over the wire.
Precalc Data Cleanup
If you remove a geography/datasource, then in order to remove their precalculated metrics from precalc.json
, you will need to run the cleanup command.
npm run precalc:data:cleanup
Test your project
Now that you have sample sketches and features, you can run the test suite.
npm run test
This will start a web server on port 8080 that serves up the data/dist
folder. Smoke tests will run geoprocessing functions against all of the sketches and features in the examples
folder. projectClient.getDatasourceUrl
will automatically read data from localhost:8080 instead of the production S3 bucket url using functions like loadFgb()
, geoblaze.parse()
.
Smoke Tests
Smoke tests, in the context of a geoprocessing project, verify that your preprocessing and geoprocessing function are working, and produce an output, for a given input. It doesn't ensure that the output is correct, just that something is produced. The input in this case is a suite of features and sketches that you manage.
Preprocessing function smoke tests (in this case src/functions/clipToOceanEezSmoke.test.ts
) will run against every feature in examples/features
and output the results to examples/output
.
All geoprocessing function smoke tests (in this case src/functions/boundaryAreaOverlapSmoke.test.ts
) will run against every feature in examples/sketches
and output the results to examples/output
.
Smoke tests are your chance to convince yourself that functions are outputting the right results. This output is committed to the code repository as a source of truth, and if the results change in the future (due to a code change or an input data change or a dependency upgrade) then you will be able to clearly see the difference and convince yourself again that they are correct. All changes to smoke test output are for a reason and should not be skipped over.
Unit Tests
Units tests go further than smoke tests, and verify that output or behavior is correct for a given input.
You should have unit tests at least for utility or helper methods that you write of any complexity, whether for geoprocessing functions (backend) or report clients (frontend).
You can also write unit tests for your UI components using testing-library.
Each project you create includes a debug launcher which is useful for debugging your function. With the geoprocessing repo checked out and open in VSCode, just add a breakpoint or a debugger
call in one of your tests or in one of your functions, click the Debug
menu in the left toolbar (picture of a bug) and select the appropriate package. The debugger should break at the appropriate place.
Debugging Tests
See the Testing page for additional options for testing your project.
Default geography
When smoke tests run, they should run for the default geography, without needing to be told so, because of the standard boilerplate code for a geoprocessing function:
export async function boundaryAreaOverlap(
sketch: Sketch<Polygon> | SketchCollection<Polygon>,
extraParams: DefaultExtraParams = {}
): Promise<ReportResult> {
const geographyId = getFirstFromParam("geographyIds", extraParams);
const curGeography = project.getGeographyById(geographyId, {
fallbackGroup: "default-boundary",
});
If you want to run smoke tests against a different geography, just to see what it produces, then you will have to do it explicitly in your smoke test:
const metrics = await boundaryAreaOverlap(sketch, {
geographyIds: ["my-other-geography"],
});
Storybook
You can view the results of your smoke tests using Storybook. It's already configured to load all of the smoke test output for each story.
npm run storybook
Check out advanced storybook usage when necessary.
From here on, you can continue to extend your reports -- adding more, adding language translation, adding additional data and new analytics, etc. After this point, we need to integrate with AWS so the reports can be hosted and connected to your seasketch.com project.
First Project Build
A build
of your application packages it for deployment, so you don't have to build it until you are ready. Specifically it:
- Checks all the Typescript code to make sure it's valid and types are used properly.
- Transpiles all Typescript to Javascript
- Bundles UI report clients into the
.build-web
directory - Bundles geoprocessing and preprocessing functions into the
.build
directory.
To build your application run the following:
npm run build
Debugging build failure
If the build step fails, you will need to look at the error message and figure out what you need to do. Did it fail in building the functions or the clients? 99% of the time you should be able to catch these errors sooner. If VSCode finds invalid Typescript code, it will warn you with files marked in red
in the Explorer panel or with red markes and squiggle text in any of the files.
If you're still not sure try some of the following:
- Run your smoke tests, see if they pass
- When was the last time your build did succeed? You can be sure the error is caused by a change you made since then either in your project code, by upgrading your geoprocessing library version and not migratin fully, or by changing something on your system.
- You can stash your current changes or commit them to a branch so they are not lost. Then sequentially check out previous commits of the code until you find one that builds properly. Now you know that the next commit cause the build error.
Deploy your project
A deploy
of your application uses aws-cdk
to inspect your local build and automatically provision all of the necessary AWS resources as a single CloudFormation stack.
This includes:
- S3 storage buckets for publishing datasources and containing bundled Report UI components
- Lambda functions that run preprocessing and geoprocessing functions on-demand
- A Gateway with REST API and Web Socket API for clients like SeaSketch to discover, access, and run all project resources over the Internet.
- A DynamoDB database for caching function results
For every deploy after the first, it is smart enough to compute the changeset between your local build and the published stack and modify the stack automatically.
Setup AWS
You are not required to complete this step until you want to deploy your project and integrate it with SeaSketch. Until then, you can do everything except publish
data or deploy
your project.
You will need to create an AWS account with an admin user, allowing the framework to deploy your project using CloudFormation. A payment method such as a credit card will be required.
Expected cost: free to a few dollars per month. You will be able to track this.
- Create an Amazon [AWS account] such that you can login and access the main AWS Console page (https://aws.amazon.com/premiumsupport/knowledge-center/create-and-activate-aws-account/).
- Create an AWS IAM admin account. This is what you will use to manage projects.
AWSCLI
If you are using a Docker devcontaine to develop reports you should already have access to the aws
command. But if you are running directly on your host operating system you will need to install AWS CLI and configure it with your IAM account credentials.
Extra steps for Windows
Windows you have the option of installing awscli for Windows and then exposing your credentials in your Ubuntu container. This allows you to manage one set of credentials.
Assuming your username is alex
, once you've installed awscli in Windows, confirm you now have the following files under Windows.
C:\Users\alex\.aws\credentials
C:\Users\alex\.aws\config
Now, open a Ubuntu shell and edit your bash environment variables to point to those files.
Add the following to your startup .bashrc
file.
export AWS_SHARED_CREDENTIALS_FILE=/mnt/c/Users/alex/.aws/credentials
export AWS_CONFIG_FILE=/mnt/c/Users/alex/.aws/config
Now, verify the environment variables are set
source ~/.bashrc
echo $AWS_SHARED_CREDENTIALS_FILE
echo $AWS_CONFIG_FILE
Confirm awscli is working
To check if awscli is configured run the following:
aws configure list
If no values are listed, then the AWS CLI is not configured properly. Go back and check everything over for this step.
Do the deploy
To deploy your project run the following:
npm run deploy
When the command completes, the stack should now be deployed. It should print out a list of URL's for accessing stack resources. You do not need to write these down. You can run the npm run url
command at any time and it will output the RestApiUrl, which is the main URL you care about for integration with SeaSketch. After deploy a cdk-outputs.json
file will also have been generated in the top-level directory of your project with the full list of URL's. This file is not checked into the code repository.
Example:
{
"gp-fsm-reports-test": {
"clientDistributionUrl": "abcdefg.cloudfront.net",
"clientBucketUrl": "https://s3.us-west-2.amazonaws.com/gp-fsm-reports-test-client",
"datasetBucketUrl": "https://s3.us-west-2.amazonaws.com/gp-fsm-reports-test-datasets",
"GpRestApiEndpointBF901973": "https://tuvwxyz.execute-api.us-west-2.amazonaws.com/prod/",
"restApiUrl": "https://tuvwxyz.execute-api.us-west-2.amazonaws.com/prod/",
"socketApiUrl": "wss://lmnop.execute-api.us-west-2.amazonaws.com"
}
}
Debugging deploy
- If your AWS credentials are not setup and linked properly, you will get an error here. Go back and fix it.
- The very first time you deploy any project to a given AWS data center (e.g. us-west-1), it may ask you to bootstrap cdk first. Simply run the following:
npm run bootstrap
Then deploy
again.
- If your deploy fails and it's not the first time you deployed, it may tell you it has performed a
Rollback
on the deployed stack to its previous state. This may or may not be successful. You'll want to verify that your project is still working properly within SeaSketch. If it's not you can always destroy your stack by running:
npm run destroy
Once complete, you will need to build
and deploy
again.
Publish your datasources
Once you have deployed your project to AWS, it will have an S3 bucket for publishing datasources
to.
Your datasources will need to have already been imported using import:data
and exist in data/dist for this to work.
npm run publish:data
It will ask you if you want to publish all datasources, or choose from a list.
- Note if you don't publish your datasources, then your smoke tests may work properly, but your geoprocessing functions will throw file not found errors in production.
Creating SeaSketch Project and Exporting Test Sketches
Using genRandomSketch
and genRandomFeature
is a quick way to get started with sample sketches that let's you run your smoke tests for your geoprocessing function and view them in a storybook. Once you do that, you can move on to creating example sketches for very specific locations within your planning area with exactly the sketch properties you want to test. This is most easily done using SeaSketch directly.
First, follow the instructions to create a new SeaSketch project. This includes defining the planning bounds and creating a Sketch class. You will want to create a Polygon
sketch class with a name that makes sense for you project (e.g. MPA for Marine Protected Area) and then also a Collection
sketch class to group instances of your polygon sketch class into. Note that sketch classes are where you will integrate your geoprocessing services to view reports, but you will not do it at this time.
One you've created your sketch classes, follow the instructions for sketching tools to draw one or more of your polygon sketches. You can also create one or more collections and group your sketches into them.
Finally, export your sketches and sketch collections as GeoJSON, and move them into your geoprocessing projects examples/sketches
folder.
/examples/
sketches/ # <-- examples used by geoprocessing functions
features/ # <-- examples used by preprocessing functions
Once you add your example sketches and collections to this folder, you can npm run test
and any smoke tests will automatically include these new examples and generate output for them for each geoprocessing function. You can then look at the smoke test output and ensure that it is as expected.
It's now possible for you to quickly create examples that cover common as well as specific use cases. For example are you sure your geoprocessing function works with both Sketches and Sketch Collections? Then include examples of both types. Maybe even include Sketches that overlap outside the planning area to make sure error conditions are handled appropriately. Or create a giant sketch that covers the entire planning area to make sure your reports are picking up all of the data and % overlap metrics are 100% or very close. Does your geoprocessing project handle overlapping sketches within a collection properly? Create all kinds of overlap scenarios.
Integrating Your Project with SeaSketch
Once you've deployed your project, you will find a file called cdk.outputs
which contains the URL to the service manifest for your project.
"restApiUrl": "https://xxxyyyyzzz.execute-api.us-west-2.amazonaws.com/prod/",
Now follow the SeaSketch instructions to assign services to each of your sketch classes.
If your sketch class is a Polygon or other feature type, you should assign it both a preprocessing function (for clipping) and a report client. If you installed the template-ocean-eez
starter template then your preprocessor is called clipToOceanEez
and report client is named MpaTabReport
.
If your sketch class is a collection then you only need to assign it a report client. Since we build report clients that work on both individual sketches and sketch collections, you can assign the same report client to your collection as you assigned to your individual sketch class(es).
This should give you the sense that you can create different report clients for different sketch classes within the same project. Or even make reports for sketch collections completely different from reports for individual sketches.
Create a sketch and run your reports to make sure it all works!
Upgrading your project
First, make sure you don't have any unsaved work. Then run the upgrade script.
npm run upgrade
- Review the code changes made to your project. If you have made customizations to any scripts or config files, you may need to recover those changes now.
- Check the release notes for any additional required steps.
Run the following and verify your reports are working as expected:
npm install
npm test
npm storybook
npm run build
When ready re-deploy your project as normal.
npm run deploy
If you are seeing errors or unexpected behavior, try any one of the following steps:
- Rebuild dependencies:
rm -rf node_modules && rm package-lock.json && npm install
- Reimport all datasources:
npm run reimport:data
- Republish all datasources:
npm run publish:data
- Clear AWS cache:
npm run clear-all-results
Additional Tutorials
Setup an exising geoprocessing project
This use case is where a geoprocessing project already exists, but it was developed on a different computer.
First, clone your existing geoprocessing project to your work environment, whether this is in your local docker devcontainer or Windows WSL.
Link your source data
- figure out which option was used to bring data into your geoprocessing project, and follow the steps to set it up.
- Option 1, you're good to go, the data should already be in
data/src
and src paths inproject/datasources.json
should have relative paths pointing into it. - Option 2, Look at
project/datasources.json
for the existing datasource paths and if your data file paths and operating system match you may be good to go. Try re-importing your data as below, and if it fails consider migrating to Option 1 or 3. - Option 3, if you're running a devcontainer you'll need to have made your data available in workspace by mounting it from the host operating system via docker-compose.yml (see installation tutorial) or have somehow synced or downloaded it directly to your container. Either way, you then just need to symlink the
data/src
directory in your project to your data. Make sure you point it to the right level of your data folder. Check the src paths inproject/datasources.json
. If for example the source paths start withdata/src/Data_Received/...
and your data directory is at/Users/alex/Library/CloudStorage/Box-Box/ProjectX/Data_Received
, you want to create your symlink as such
ln -s /Users/alex/Library/CloudStorage/Box-Box/ProjectX data/src
Assuming data/src
is now populated, you need to ensure everything is in order.
2.Reimport your data
This will re-import, transform, and export your data to data/dist
, which is probably currently empty.
npm run reimport:data
Say yes to reimporting all datasources, and no to publishing them (we'll get to that).
If you see error, look at what they say. If they say datasources are not being found at their path, then something is wrong with your drive sync (files might be missing), or with your symlink if you used option 3.
If all is well, you should see no error, and data/dist
should be populated with files. In the Version Control panel your datasources.json file will have changes, including some updated timestamps.
But what if git changes show a lot of red and green?
- You should look closer at what's happening. If parts of the smoke test output (examples directory JSON files) are being re-ordered, that may just be because Javascript is being a little bit different in how it generates JSON files from another computer that previously ran the tests.
- If you are seeing changes to your precalc values in precalc.json, then your datasources may be different from the last person that ran it. You will want to make sure you aren't using an outdated older version. If you are using an updated more recent version, then convince yourself the changes are what you expect, for example total area increases or decreases.
What if you just can't your data synced properly, and you just need to move forward?
- If the project was deployed to AWS, then there will be a copy of the published data in the
datasets
bucket in AWS S3. - To copy this data from AWS back to your
data/dist
directory use the following, assuming your git repo is namedfsm-reports-test
aws s3 sync s3://gp-fsm-reports-test-datasets data/dist
Managing Devcontainers
- To delete a devcontainer:
- This is often the easiest way to "start over" with your devcontainer.
- First, make sure you've pushed all of your code work to Github.
- Make sure you stop your active VSCODE devcontainer session.
- Open the Remote Explorer panel in the left sidebar.
- You can right-click and delete any existing devcontainers and volumes to start over.
- You can also see and delete them from the Docker Desktop app, but it might not be obvious which containers and volumes are which. The VSCode Remote Explorer window gives you that context.
- To upgrade your devcontainer:
- The devcontainer settings in this repository may change/improve over time. You can always pull the latest changes for your
geoprocessing-devcontainer
repository, and thenCmd-Shift-P
to open command palette and type“DevContainers: Rebuild and Reopen locally”
.
- The devcontainer settings in this repository may change/improve over time. You can always pull the latest changes for your
- To upgrade the
geoprocessing-workspace
Docker image- This devcontainer builds on the
geoprocessing-workspace
Docker image published at Docker Hub. It will always install the latest version of this image when you setup your devcontainer for the first time. - It is up to you to upgrade it after the initial installation. The most likely situation is:
- In both cases you should be able to simply update your docker image to the latest. The easiest way to do this is to:
- Push all of your unsaved work in your devcontainer to Github. This is in case the Docker
named volume
where your code lives (which is separate from the devcontainer) is somehow lost. There are also ways to make a backup of a named volume and recover it if needed but that is an advanced exercise not discussed at this time. - Stop your devcontainer session
- Go to the
Images
menu in Docker Desktop, finding yourseasketch/geoprocessing-workspace
. - If it shows as "IN USE" then switch to the
Containers
menu and stop all containers usingseasketch/geoprocessing-workspace
. - Now switch back to
Images
and pull a new version of theseasketch/geoprocessing-image
by hovering your cursor over the image, clicking the 3-dot menu on the right side and the clickingPull
. This will pull the newest version of this image. - Once complete, you should be able to restart your devcontainer and it will be running the latest
geoprocessing-workspace
.
- Push all of your unsaved work in your devcontainer to Github. This is in case the Docker
- This devcontainer builds on the
Creating a geoprocessing function
The create:report
function builds both a geoprocessing function and component based on a metric group. If you instead wish to strictly create a function, you can use:
npm run create:function
Enter some information about this function:
? Function type Geoprocessing - For sketch reports
? Title for this function, in camelCase simpleFunction
? Describe what this function does Calculates area overlap with coral cover dataset
? Choose an execution mode Async - Better for long-running processes
The command should then return the following output:
✔ created simpleFunction function in src/functions/
Geoprocessing function initialized
Next Steps:
* Update your function definition in src/functions/simpleFunction.ts
* Smoke test in simpleFunctionSmoke.test.ts will be run the next time you execut 'npm test'
* Populate examples/sketches folder with sketches for smoke test to run against
The function will have been added to project/geoprocessing.json
in the geoprocessingFunctions
section.
The geoprocessing function file starts off with boilerplate code every geoprocessing function should have. It then includes an example of loading both vector data and raster data from global datasources and calculating some simple stats, and returning a Result
payload. To explain in more detail:
First a Typescript interface is defined that defines the shape of the data that the geoprocessing function will return. This defines an object
with properties area
and nearbyEcoregions
, minTemp
, and maxTemp
.
export interface SimpleResults {
/** area of sketch within geography in square meters */
area: number;
/** list of ecoregions within bounding box of sketch */
nearbyEcoregions: string[];
/** minimum surface temperature within sketch */
minTemp: number;
/** maximum surface temperature within sketch */
maxTemp: number;
}
Then comes the actual geoprocessing function, which accepts a sketch
as its first parameters. It can be either a single Sketch Polygon/Multipolygon, or a SketchCollection containing Polygons/MultiPolygons. The second parameter is extraParams
, which is an object that may contain [one or more identifiers] passed by the report client when invoking the geoprocessing function (https://seasketch.github.io/geoprocessing/api/interfaces/geoprocessing.DefaultExtraParams.html)
async function yourFunction(
sketch:
| Sketch<Polygon | MultiPolygon>
| SketchCollection<Polygon | MultiPolygon>,
extraParams: DefaultExtraParams = {}
): Promise<AreaResults> {
First, the function will get any geographyIds
that may have been passed by the report client via extraParams
to specify which geography to run the function for. It will then use getGeographyById
to get the geography object with that id from geographies.json
. If the geographyId
is undefined, then it will return the default geography.
// Use caller-provided geographyId if provided
const geographyId = getFirstFromParam("geographyIds", extraParams);
// Get geography features, falling back to geography assigned to default-boundary group
const curGeography = project.getGeographyById(geographyId, {
fallbackGroup: "default-boundary",
});
Next, the function will handle the situation where the sketch
crosses the 180 degree antimeridian (essentially the dateline) by calling splitSketchAntimeridian
. If the sketch crosses the antimeridian, it will clean (adjust) the coordinates to all be within -180 to 180 degrees. Then it will split the sketch into two pieces, one on the left side of the antimeridan, one on the right side. This splitting is required by many spatial libraries to perform operations on the sketch. Vector datasources are also split on import for this reason.
// Support sketches crossing antimeridian
const splitSketch = splitSketchAntimeridian(sketch);
After that, the sketch is clipped to the current geography, so that only the portion of the sketch that is within the geography remains.
// Clip to portion of sketch within current geography
const clippedSketch = await clipToGeography(splitSketch, curGeography);
Now we get to the core of what this particularly geoprocessing function is designed to do. Think of this as a starting point that you can adapt to meet your needs.
First, we'll fetch the Marine Ecoregions of the World polygon features that overlap with the bounding box of the clippedSketch
. Then reduce this down to an array of ecoregion names. You could take this further to reduce down to only the ecoregions that intersect with the sketch.
// Fetch eez features overlapping sketch bbox
const ds = project.getExternalVectorDatasourceById("meow-ecos");
const url = project.getDatasourceUrl(ds);
const eezFeatures = await getFeatures(ds, url, {
bbox: clippedSketch.bbox || bbox(clippedSketch),
});
// Reduce to list of ecoregion names
const regionNames = eezFeatures.reduce<Record<string, string>>(
(regionsSoFar, curFeat) => {
if (curFeat.properties && ds.idProperty) {
const regionName = curFeat.properties[ds.idProperty];
return { ...regionsSoFar, [regionName]: regionName };
} else {
return { ...regionsSoFar, unknown: "unknown" };
}
},
{},
);
Next, we'll fetch all the minimum and maximum surface temperature measurements within the clippedSketch
and then calculate the single minimum and maximum values.
const minDs = project.getRasterDatasourceById("bo-present-surface-temp-min");
const minUrl = project.getDatasourceUrl(minDs);
const minRaster = await loadCog(minUrl);
const minResult = await geoblaze.min(minRaster, clippedSketch);
const minTemp = minResult[0]; // extract value from band 1
const maxDs = project.getRasterDatasourceById("bo-present-surface-temp-max");
const maxUrl = project.getDatasourceUrl(maxDs);
const maxRaster = await loadCog(maxUrl);
const maxResult = await geoblaze.max(maxRaster, clippedSketch);
const maxTemp = maxResult[0]; // extract value from band 1
The final step of the function is always to return the result payload back to the report client
return {
area: turfArea(clippedSketch),
nearbyEcoregions: Object.keys(regionNames),
minTemp,
maxTemp,
};
At the bottom of the file, the geoprocessing function is wrapped into a GeoprocessingHandler
which is what gets exported by the file. This handler provides what the geoprocessing function needs to run in an AWS Lambda environemnt, specifically to be called via REST API by a report client, receive input parameters and send back function results. It also lets you fine tune the hardware characteristics of the Lambda to meet performance requirements at the lowest cost. Specifically, you can increase the memory available to the Lambda up to 10240
KB, which will also increase the cpu size and number. You can also increase the timeout up 900
seconds or 15 minutes for long running analysis, though 180
- 300
seconds is probably the longest amount a user is willing to wait. You will want to use an async
function over sync
if the function runs for more than say 5 seconds with a typical payload. The title
and description
fields are published in the projects service manifest to list what functions are available.
export default new GeoprocessingHandler(calculateArea, {
title: "calculateArea",
description: "Function description",
timeout: 60, // seconds
memory: 1024, // megabytes
executionMode: "async",
// Specify any Sketch Class form attributes that are required
requiresProperties: [],
});
To publish your new function:
- Add it to the
project/geoprocessing.json
file under thegeoprocessingFunctions
section. - Build and publish your project as normal.
Creating a Report Client
To create a new report client simply run:
npm run create:client
Enter some information about this report client:
? Name for this client, in PascalCase ReefReport
? Describe what this client is for calculating reef overlap
? What is the name of geoprocessing function this client will invoke? (in camelCase) reefAreaOverlap
The command should then return the following output:
✔ created ReefReport client in src/clients/
Geoprocessing client initialized
Next Steps:
* Update your client definition in src/clients/ReefReport.tsx
* View your report client using 'npm storybook' with smoke test output for all geoprocessing functions
Assuming you named your client the default SimpleReport
, it will have been been added to project/geoprocessing.json
in the clients
section. A SimpleReport.tsx
file will have been added to src/clients
folder. It is responsible for rendering your new SimpleCard
component from the src/components
folder and wrapping it in a language Translator
. Think of the Card component as one section of a report. It executes a geoprocessing function and renders the results in a way that is readable to the user. You can add one or more Cards to your Report client. If your report gets too long, you can split it into multiple ReportPages. See the TabReport example of how to add a SegmentControl
with multiple pages.
SimpleReport.stories.tsx
and SimpleCard.stories.tsx
files will both be included that allows you to view your Report and Card components in storybook to dial in how they should render for every example sketch and their smoke test output.
After adding a report client, be sure to properly setup user displayed text for translation. You'll need to follow the full workflow to extract the english translation and add the translations for other languages.
Updating A Datasource
When updating a datasource, you should try to take it all the way through the process of import
, precalc
, and publish
so that there's no confusion about which step you are on. It's easy to leave things in an incomplete state and its not obvious when you pick it back up.
- Edit/update your data in data/src
- Run
npm run reimport:data
, choose your source datasource and choose to not publish right away.data/dist
will now contain your updated datasource file(s). - Run
npm run precalc:data
, choose the datasource to precalculate stats for. npm test
to run your smoke tests which read data fromdata/dist
and make sure the geoprocessing function results change as you would expect based on the data changes. Are you expecting result values to go up or down? Stay about or exactly the same? Try not to accept changes that you don't understand.- Add additional sketches or features to your smoke tests as needed. Exporting sketches from SeaSketch as geojson and copying to
examples/sketches
is a great way to do this. Convince yourself the results are correct. - Publish your updated datasets with
npm run publish:data
. - Clear the cache for all reports that use this datasource with
npm run clear-results
and type the name of your geoprocessing function (e.g.boundaryAreaOverlap
). You can also opt to just clear results for all reports withnpm run clear-all-results
. Cached results are cleared one record at a time in dynamodb so this can take quite a while. In fact, the process can run out of memory and suddenly die. In this case, you can simply rerun the clear command and it will continue. Eventually you will get through them all. - Test your reports in SeaSketch. Any sketches you exported should produce the same numbers. Test with any really big sketches, make sure your data updates haven't reached any new limit. This can happen if your updated data is much larger, has more features, higher resolution, etc.
Custom Sketch Attributes
Sketch attributes are additional properties provided with a Sketch Feature or a Sketch Collection. They can be user-defined at draw time or by the SeaSketch platform itself. The SeaSketch admin tool lets you add custom attributes to your sketch classes. SeaSketch will pass these sketch attributes on to both preprocessing and geoprocessing functions.
Common use cases:
- Preprocessor
- Passing an extra yes/no attribute for whether to include existing protected areas as part of your sketch, or whether to allow the sketch to extend beyond the EEZ, or to include land.
- Passing a numeric value to be used with a buffer.
- Geoprocessor
- Provide language translations for each sketch attribute name and description, for each language enabled for the project.
- Assign a protection level or type to an area, such that the function (and resulting report) can assess against the required amount of protection for each level.
- Assign activities to an area, that the function can assign a protection level. This is particularly useful when reporting on an entire SketchCollection. The function can group results by protection level and ensure that overlap is not double counted within each group, but allow overlap between groups to go to the higher protection level.
Accessing sketch properties from report client
The main way to access sketch attributes from a browser client is the useSketchProperties() hook. Examples include:
- SketchAttributesCard and story with source
Accessing sketch properties from function
Withing a preprocessing or geoprocessing function, the SketchProperties are provided within every sketch. Within that are userAttributes that contain all of the user-defined attributes.
For example, assume your Polygon sketch class contains an attribute called ACTIVITIES
which is an array of allowed activities for this sketch class. And you have a second attribute called ISLAND
that is a string containing the name of the island this sketch is located. You can access it as follow:
export async function protection(
sketch: Sketch<Polygon> | SketchCollection<Polygon>
): Promise<ReportResult> {
const sketches = toSketchArray(sketch);
// Complex attributes are JSON that need to be parsed
const activities = getJsonUserAttribute(sketches[0], 'ACTIVITIES')
// Simple attributes are simple strings or numbers that can be used directly
const island = getUserAttribute(sketches[0], 'ISLAND')
Examples of working with user attributes:
- getIucnCategoryForSketches takes an array of sketches, extracts the list of IUCN
ACTIVITIES
the sketch designated as allowed for each sketch, and returns the category (protection level) for each sketch. The sketch array can be generated from thesketch
parameter passed to a geoprocessing functions using toSketchArray()`. toSketchArray helps you write single functions that work on either a single sketch or a collection of sketches. - isContiguous function that optionally merges the contiguous zone with the users sketch. Checks for existence of a specific user attribute
Adding and Passing Extra Parameters
Sometimes you want to pass additional parameters to a preprocessing or geoprocessing function that are defined outside of the sketch creation process by seasketch or through the report itself. These extraParams
are separate from the sketch
. They are an additional object passed to every preprocessing and geoprocessing function.
Use Cases:
- Preprocessor
- Passing one or more
eezs
to a global clipping function that specifies optional EEZ boundaries to clip the sketch to in addition to removing land.
- Passing one or more
- Geoprocessor
- Subregional planning. Passing one or more
geographyIds
, as subregions within an EEZ. This can be used to when calculating results for all subregions at once doesn't make sense, or is computationally prohibitive. Instead you may want the user to be able to switch between subregions, and the reports will rerun the geoprocessing function with a different geography and update with the result on-demand.
- Subregional planning. Passing one or more
Passing Extra Parameters To Geoprocessing Functions
Report developers will pass the extra parameters to a geoprocessing function via the ResultsCard. It must be an object where the keys can be any JSON-compatible value. Even nested objects and arrays are allowed.
<ResultsCard
title={t("Size")}
functionName="boundaryAreaOverlap"
extraParams={{ geographyIds: ["nearshore", "offshore"] }}
useChildCard
>
A common next step for this is to maintain the array of geographyIds in the parent Card, and potentially allow the user to change the values using a UI selector. If the value passed to extraParams
changes, the card will re-render itself, triggering the run of a new function, and displaying the results.
Internally the ResultsCard uses the useFunction hook, which accepts extraParams
.
useFunction('boundaryAreaOverlap', { geographyIds: ['santa-maria'] }
If invoking functions directly, such as SeaSketch invoking a preprocessing function, the extraParams
can be provided in the event body.
{
"feature": {...},
"extraParams": { "eezs": ["Azores"], "foos": "blorts", "nested": { "a": 3, "b": 4 }}
}
Accessing Extra Parameters In Functions
Both preprocessing and geoprocessing functions receive a second extraParams
parameter. The default type is Record<string, JSONValue>
but the implementer can provide a narrower type that defines explicit parameters.
Geoprocessing function:
/** Optional caller-provided parameters */
interface ExtraParams {
/** Optional ID(s) of geographies to operate on. **/
geographyIds?: string[];
}
export async function boundaryAreaOverlap(
sketch: Sketch<Polygon> | SketchCollection<Polygon>,
extraParams: ExtraParams = {}
): Promise<ReportResult> {
const geographyIds = extraParams.geographyIds
console.log('Current geographies', geographyIds)
const results = runAnalysis(geographyIds)
return results
Preprocessing function:
interface ExtraParams {
/** Array of EEZ ID's to clip to */
eezs?: string[];
}
/**
* Preprocessor takes a Polygon feature/sketch and returns the portion that
* is in the ocean (not on land) and within one or more EEZ boundaries.
*/
export async function clipToOceanEez(
feature: Feature | Sketch,
extraParams: ExtraParams = {},
): Promise<Feature> {
if (!isPolygonFeature(feature)) {
throw new ValidationError("Input must be a polygon");
}
/**
* Subtract parts of feature/sketch that overlap with land. Uses global land polygons
* unionProperty is specific to subdivided datasets. When defined, it will fetch
* and rebuild all subdivided land features overlapping with the feature/sketch
* with the same gid property (assigned one per country) into one feature before clipping.
* This is useful for preventing slivers from forming and possible for performance.
*/
const removeLand: DatasourceClipOperation = {
datasourceId: "global-clipping-osm-land",
operation: "difference",
options: {
unionProperty: "gid", // gid is assigned per country
},
};
/**
* Optionally, subtract parts of feature/sketch that are outside of one or
* more EEZ's. Using a runtime-provided list of EEZ's via extraParams.
* eezFilterByNames allows this preprocessor to work for any set of EEZ's
* Using a project-configured planningAreaId allows this preprocessor to work
* for a specific EEZ.
*/
const removeOutsideEez: DatasourceClipOperation = {
datasourceId: "global-clipping-eez-land-union",
operation: "intersection",
options: {
propertyFilter: {
property: "UNION",
values: extraParams?.eezs || [project.basic.planningAreaId] || [],
},
},
};
// Create a function that will perform the clip operations in order
const clipLoader = genClipLoader(project, [removeLand, removeOutsideEez]);
// Wrap clip function into preprocessing function with additional clip options
return clipToPolygonFeatures(feature, clipLoader, {
maxSize: 500000 * 1000 ** 2, // Default 500,000 KM
enforceMaxSize: false, // throws error if feature is larger than maxSize
ensurePolygon: true, // don't allow multipolygon result, returns largest if multiple
});
}
Writing stories with extraParams
Default smoke tests typically don't pass extraParams to the preprocessing or geoprocessing function but they can. Just know that each smoke test can only output results for one configuration of extraParams. And storybook can only load results for one smoke test run. This means that in order to test multiple variations of extraParams, you will need to create multiple smoke tests. You could even write multiple smoke tests that each write out results all in one file.
Example smoke test (e.g. boundaryAreaOverlapExtraParamSmoke.test.ts):
test("boundaryAreaOverlapSantaMariaSmoke - tests run with one subregion", async () => {
const examples = await getExamplePolygonSketchAll();
for (const example of examples) {
const result = await boundaryAreaOverlap(example, { geographyIds: ['santa-maria']});
expect(result).toBeTruthy();
writeResultOutput(result, "boundaryAreaOverlapSantaMaria", example.properties.name);
}
}
Subdividing Large Datasets
If you have very large polygon datasets (think country or global data) with very large complex polygon, the standard data import process which uses flatgeobuf, may not be sufficient. An alternative is to use a VectorDataSource
specially created by SeaSketch. It's based on a method described by Paul Ramsey in this article of subdividing your data, cutting it up along the boundaries of a spatial index.
Once the polygons have been subdivided, they can be put into small files encoded in the geobuf format, and a lookup table created for the index. This entire bundle can be then put into S3 cloud storage.
The magic comes in being able to request polygons from this bundle in our geoprocessing functions. A VectorDataSource
class is available that lets us request only the polygon chunks from our subdivided bundle that overlap with the bounding box of our sketch that we are currently analyzing. It even caches request results locally so that subsequent requests do not call out to the network if needed.
VectorDataSource
can also rebuild the polygon chunks back into the original polygons they came from. Imagine you've subdivide a dataset of country boundary polygons for the entire world. You've subdivided them, and now you can reconstruct them back into country polygons. You simply need to maintain an attribute with your polygons that uniquely identifies how they should be reconstructed. This could be a countryCode
or just a non-specific gid
.
Here is an example of use end-to-end. Note this is quite a manual process. Future framework versions may try to automate it.
- data prep script.
- sql subdivide script run by the data prep script
- publish script brings the subdivided polygons out of postgis, encodes them in geobuf format, builds the index, and publishes it all to a standalone S3 bucket that is independent of your project. The url of the S3 bucket will be provided once complete. You can ``--dry-run` the command to see how many bundles it will create and how big they'll be. The sweet spot is bundles about ~25KB in size. Once you've found that sweet spot you can do the actual run.
- use of VectorDataSource in gp function
This is the method that is used for the global land
and eez
datasources. Here is a full example of subdividing OpenStreetMap land polygons for the entire world. This is what is used for the clipToOceanEez
script that comes with the ocean-eez
starter template.
Advanced storybook usage
There are multiple ways to introduce state into your stories. Many components draw their state from the ReportContext, which contains a lot of the information passed to the app on startup from seasketch.
There are 3 common methods for creating a story with context. All of these methods are built on ReportStoryLayout
.
ReportStoryLayout is a component used by storybook that wraps your story in the things that the top-level App component would provide including setting report context, changing language, changing text direction, as well as offering dropdown menus for changing the language and the report width for different device sizes.
- ReportDecorator - decorator that wraps story in ReportStoryLayout and otherwise uses default context value. A good starting point because it's simple. (see Card.stories.tsx). Language translation will work in the story with this method.
- If you want to override the context in your stories use
createReportDecorator()
- decorator generator that wraps story in ReportStoryLayout and lets you override report context. Because a decorator can only be specified for the whole file, you should only use this if you want all stories in the file to be overidden with the same context. (see SegmentControl.stories.tsx). But you can split them up into multiple story files. Language translation will work in the story with this method. - For optimal control can use the ReportCardDecorator in combindation with
sampleSketchReportContextValue()
to set the context per story (see LayerToggle.stories.tsx). Language translation will not work with the story in this method.